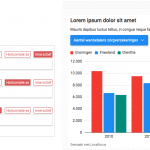
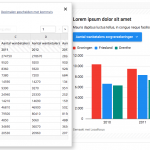
The new editors for the visualization module and table module are live.
- Both modules now have a kind of mini-Excel.
- You can always add new rows and columns and the chart or table will update immediately.
- You can link a Google Sheet. Handy if you want to add new rows regularly.
- Many other options have been tweaked and we hope they work better for you.
Where have the maps gone in the visualization module?
We have done our best to move all the old features. The maps have been moved from the visualization module to the map module.
Help, something is not working
Contact us and we will see if we can fix it. The old editors are still available, so you can continue working as usual. Click on “use the old editor” in the “What do you want to create” overview.